How Loyal Are You?
Strong customer loyalty should be a primary goal for any marketer. Due to high customer acquisition costs, maintaining customers has a significant impact on your bottom line and builds growth and profitability for your company.
Yet few marketers use market research to measure customer loyalty. We tend to focus more on customer satisfaction than loyalty. Obviously, satisfaction can lead to loyalty, but there is a distinct difference between the two. Satisfaction and loyalty can both earn repeat purchases, however loyalty can also lead to Brand Affinity – where the customer self-identifies with the brand and truly becomes an ambassador for your product.
Farmer Loyalty
Agriculture is a category where “word-of-mouth” and product endorsement are extremely important to sales growth. This is particularly true with products or technologies that are newly introduced to the market. The agricultural product adoption curve is typically slow at best but can be accelerated through successful trial and endorsement by other farmers.
When product endorsement and loyalty reach the highest level, we define it as Brand Affinity.
Farmers exhibit strong Brand Affinity in several product categories. The obvious category is tractors, where many farmers are either “green” or “red” in their brand loyalty and affinity. It doesn’t stop with tractors – Brand Affinity is an important factor in most farm purchases, big or small.
Net Promoter Score
When conducting agricultural customer satisfaction studies, we always recommend to clients that they include the Net Promoter Score (NPS) in surveying to gain insight into brand loyalty and affinity.
Simply put, the NPS is a measure of a customer’s overall opinion of a company. Established by Bain & Company in 2003, it’s based on the response to a simple but powerful question – “How likely are you to recommend us to a friend or colleague?” – and uses a 0 to 10 scale (with 10 being “extremely likely”). Based on the customer’s response, they are assigned a label. “Detractors” responded with a score in the 0-6 range, “Passives” in the 7-8 range, and “Promoters” in the 9-10 range.
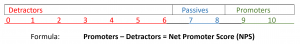
Example: Four hundred corn hybrid customers are surveyed with 60% rating their likelihood to recommend the brand with a 9 or 10; 30% rating likelihood with a 7 or 8, and the remaining 10% rating likelihood 0 through 6. To determine NPS, start with the Promoter percentage (60%), subtract the Detractors (10%) and the result is a 50% Net Promoter Score.
NPS should be tracked longitudinally or over several waves of surveys. Specific marketing strategies should focus on maintaining or increasing the Promoters for your product or brand.
NPS is Key to Market Share Growth
When it comes to agriculture, NPS is one of the most important customer metrics to track. By increasing the number of Promoters, those with strong brand loyalty and affinity, you are increasing the size of your sales force and promotion without the added marketing expense.
To learn more about NPS and how it can be integrated into your market research approach, contact [email protected].